Analysis of The Letter to the Editor Section of The Egyptian Gazette
Introduction and Research Question
When I began the research process, I was fascinated by the passion behind the Letters to the Editor Section. There were vile arguments about political views, people contradicting articles previously published, people offering a unique perspective, and people professing their undying support. This variety left me with many questions. After a difficult research process, I am setting out to answer a complicated question: What is the purpose of the letters to the editor section in the Egyptian Gazette? The answer combines qualitative and quantitative research to tackle this question from the perspective of the newspaper and the writers.
Queries and Visualizations
My question changed a lot over the course of the process. I initially pursued the newspaper’s opinion of the letter to the editor section, but that led to vague, unquantifiable results. So I endeavored to gather why the newspaper published the letters and why people wrote the letters. My original jumping off point was to find out what was discussed in the Letters to the Editor section. I started with the following Xpath query:
//div[@feature="letters"]//head
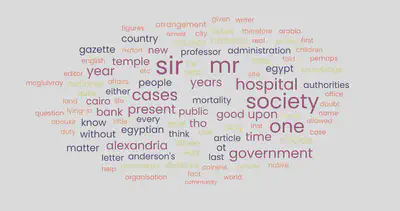
This pulled the headling of every Letter to the Editor feature that was in the Egyptian Gazette. I then copied and pasted the contents of every section in 1904 into a word cloud generator.
Once I understood a little bit about what was generally talked about in this feature, I looked at the relationship between the date a letter was submitted to the paper and the turnover until it was published. I sought to identify the opposition or support of the newspaper, then compare the delay time between the two. Would it take shorter or longer for a positive letter to get published than a negative letter? What does that mean about the intentions of the newspaper? I set out to find my answer. I searched for the Xpath query:
//div[@feature="letters"]//dateline
This query scans the Egyptian Gazette repository and looks for the dateline within every section of the Letters to the Editor feature. The query drew 122 results, and I could begin the tedious reading process. I had to identify opposition and support. As I read, I created an identification system and labeled each position behind the letter as a complaint, support, or expert. I labeled these based on the tone, style, and material the letter covered. The more I read, the more I realized it might have been more effective to identify the topic that the letter covered (ex. politics, sports, socioeconomics, asking questions, complaining about public facilities, reporting concerning incidents). If I had categorized data by content, I could have found more results regarding the purpose of the letters section. Instead, I used position labels, dates of release, and the date of the letter. This allowed me to produce an initial visualization.
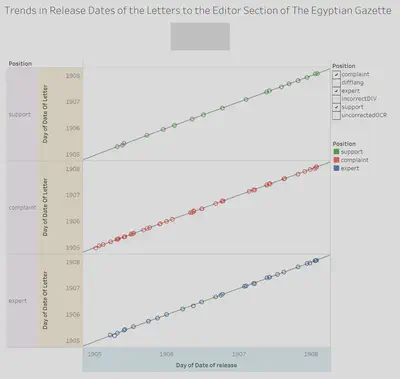
I was ecstatic to see the upward trends, but I wanted more than what this visualization presented. I saw each position but wanted to complete a deeper comparison to see if there were any trends I was missing. I went back to the data and added a column for the delay (in days) between the date the letters were written and published. This numerical measure added complexity to the graph and allowed me to compare each position’s submission date more closely.
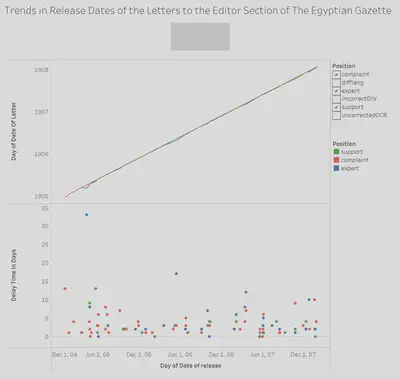
This visualization shows trends in release dates of the Letters to the Editor section of the Egyptian Gazette. The graph on top shows the date the letter was written and the date it was released for each position. The graphs overlaps, so the positions that skew low or high are observable. The lower graph depicts each letter, whether it supports, complains, or is an expert, and the time in days between writing and publishing that letter. This allows me to delve deeper into my quantitative research and make conclusions.
Interpreting Data and Supplementary Information
With this complete visualization, I began using this quantitative data to explain the purpose of the letters to the editor section for the newspaper. The bottom graph of my finalized visualization is very sprawling. The data seems inconclusive; however, the letters that offer an expert opinion have less universalized delay times. The results vary from 0 to 33 days. This is more sprawling than any support or complaint of the paper. Since many expert opinions were less time sensitive and referenced their unique perspective, it was slower to publish for the newspaper. I expected a big difference between the delay times of support and complaints. I thought the newspaper would want more positive feedback rather than negative feedback included in the paper. The results showed more complaints than supportive letters, and the two positions overlapped in delay times. There were no conclusive results about the turnover from being written to published. This surprised me, and I did some qualitative research to understand how this makes sense.
As I read the letters to the editor section, I noticed the overwhelming quantity of letters and activity surrounding any controversial topic. In June of 1907, a letter featured an extremely angry horse-race goer. For the entire month, people weighed in with their opinions on the matter. It got insanely vile with these oppositions, and I was surprised the newspaper would want to include this fighting. Then, after looking at the graph, I saw a spike in the number of letters in June of 1907. Similar results occurred with each discussed contentious topic. Having controversial and “negative” letters published, led to an uptick in viewer participation for the Egyptian Gazette. This explains why the newspaper would want to publish viewer opinions. It gives people a say in the newspaper and promotes more viewership.
I was curious about this trend and wondered if this was specific to the Egyptian Gazette or common across other newspapers. I did some research, and according toMr. Blunt and the “Times”, (a book about the Times magazine in Egyptian affairs published in 1907), the letters to the editor section has engaged audiences for many years. It is interesting to see how this compares with my findings and adds complexity to the issue.
The Letters to the Editor section, a seemingly passive addition to the paper, has a lot of meaning for the readers that increase involvement and the newspaper that increases viewership.
Difficulties Faced
The research process was not without its difficulties. Working with an incomplete data set means I have skewed results. Without that information, I am missing out on possible abnormalities that could lead to more research questions and deeper complexity. Another challenge throughout this process has been a changing understanding of the meaning of the section. Initially, I thought the letter to the editor section was a place for viewers to oppose and support the paper. The more I read, the deeper I understood that it was a place for viewers to challenge and question each other. This deeper understanding made it difficult to answer my original question. I had to generalize my findings to answer a workable research question.
Using tableau and OxygenXML also proved to be challenging. The Xpath query and visualization took a lot of tweaking to get the data I wanted to present. In my original visualization, the viewer’s positions were separated and stacked rather than combined as I had hoped. It took a lot of trial and error to produce a visualization that made me proud.
Having a project that combined qualitative and quantitative data also proved to be challenging. It took the analysis of numbers and a graph, and I had to look through it with a qualitative lens and understand the historical context. It was an insightful experience to have a combined project, but I think it strengthened my argument since I could analyze data and stories.
Conclusion
This project has given me a deeper insight into the Letters to the Editor section of the Egyptian Gazette. I observed my visualization that looks at quantitative analysis of the delay between the written dates and published dates of the letters. The data showed trends and opposition or support of different topics. After combining this with the qualitative research about the contents of the Letters to the Editor section (specifically horse-goer agitation), I learned the value, of the newspaper, in publishing controversial topics. It increases viewership and reader involvement in a way that allows readers to voice their opinions and be more well-educated. What started as a project to figure out why people were so angry in letters to the paper, taught me a lot along the way. I sought to answer the difficult question about the purpose of the Letters to the Editor section, and I think there was a lot of fascinating data and stories to read through.
Rainey Sharrow
Student
The author, a student at Florida State University, was enrolled in the digital microhistory lab in fall 2022.