Capital Market Integration
In the process of digitally transcribing the Egyptian Gazette, I was struck by how much of the paper was devoted every day to financial tables, commodity price lists, and information on cargo shipping. As the paper was primarily geared towards the international businessman, I suppose this comes as no surprise. It reminded me, however, of a banking crisis that occurred in Alexandria in 1907. At the local level, the blame is normally placed on excessive speculation in the real estate market, but the underlying causes are said to have emanated in global capital markets. Specifically, massive insurance payments made in San Francisco after the Great Fire dramatically increased the local money supply, spurring inflation and imbalances which were then transmitted into global financial markets. The implication of all this, however, is that by the turn of the century, global capital markets had integrated to a sufficient level to allow seemingly local shocks to have international ramifications. In other words, one may consider this from a perspective of globalization. Just how connected were the different financial markets in America, England and Egypt? To what extent did investors live in a “globalized” world, where international news was consumed to make business decisions at the local level? When what did was going on “over there” matter “over here”? I would like to ask my serial question then in a way which would return quantitative data on the responsiveness of the market in Alexandria to international factors. But what variables should I examine?
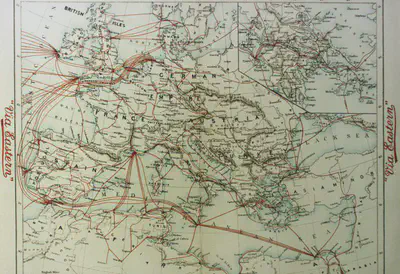
The first step is to consider the source in its original context. From an economic perspective, the paper would convey information from international markets to investors in Alexandria, which would then be processed and acted upon by the investor. A natural first question then, is to consider the scope of the “international” world in Alexandria in 1905. The process of globalization is often described as a reduction in the size of the world-not in a literal sense, but in the way that global flows of information have become instantaneous. The internet was obviously a few years off in 1905, but the world was revolutionized in much the same way by the development and growth of trans-oceanic telegraph lines. Gehan Rachty, writing of the history of telecommunications in Egypt, notes that telegraphic lines existed in Egypt as early as 1856. He traces the growing network’s development in tandem with increasing British involvement in Egypt, all part of “the British administration’s self-interested desire to link Egypt to the United Kingdom in the world.” The map below shows details of Eastern Telegraph lines in the Mediterranean in 1900. It is interesting to note that Alexandria appears to be a regional hub for telecommunications at the time.
To try and get an idea of the scope of the “international world” in 1905, I decided to start by examining how many unique places are mentioned in the Gazette. I utilized the following X-path query:
Query 1: //placeName
Although simple, this query returned 6,802 place names. After removing the basic expressions and duplicates, I was left with 1,185 unique locations. I imported the date into Google Maps, and after correcting the obvious errors, I was left with the resulting map:
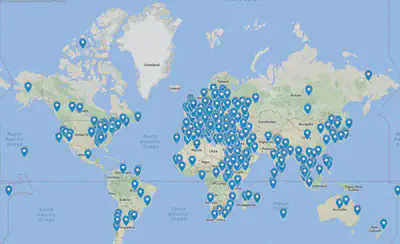
This diagram demonstrates that the Gazette delivered information from all over the globe, but the geographic distribution is far from random. To examine this geographic scope in terms of technological advancement, I overlaid a map of the Eastern Telegraph Company’s global telegraph lines on top of the mapped place names. The following was the result:
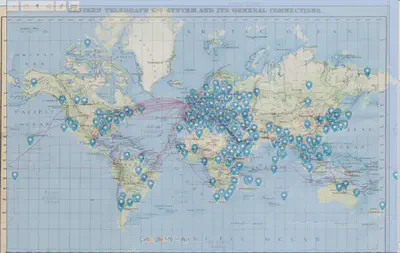
Fascinatingly, the geographic spread of place names mentioned in the Egyptian Gazette matches the distribution of existing telecommunications infrastructure. Even the data points that appear to be outliers fit with the distribution of cables. While globalization is usually used to describe planet-wide changes, the data in this map shows why this approach is misleading. Telegraphic lines appear to converge on centers of contemporary trade, and then radiate out into what would have been colonial holdings. Thus this world could be described as “globalized” and “interconnected,” but in reality it’s only the economically relevant places that are linked to this network, and the empty regions of this diagram show those areas not yet integrated. The question here, however, is economic in nature, and confined to the particular case of Egypt’s capital market integration. This diagram then seems to affirm a high level of integration of Egypt into global markets from the standpoint of availability of global information.
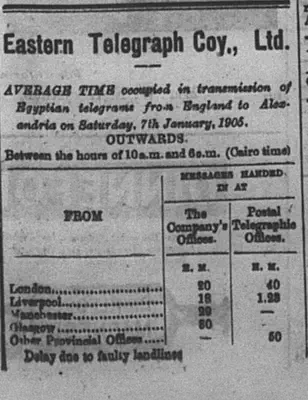
While the trans-oceanic linkages bring images of global web connections to mind, the reality is that these information flows were not instantaneous, and the undersea cables were often damaged and unusable until they were repaired or replaced. Further, if the map of telegraphic lines is examined from the perspective of World Systems Theory, the hierarchy of the global economy is evident in the distribution of lines. The core nations are represented by those with concentrations of incoming lines, while the semi-peripheral and peripheral can by located by tracing the telegraphic lines outwards from the hubs. Thus the information in the paper may have not come directly from India, for example, but may have been transmitted from India to London, and then to Alexandria. All these points suggest that information flows to Alexandria would have significant degrees of short term volatility. But how to measure this volatility? Thankfully, the Egyptian Gazette published a table that shows the previous day’s transmission time from England to Alexandria of both the Eastern Telegraph Company and the Postal Telegraphic offices.
I decided to query the table using xml:id to discover how many instances of this table there were, and utilized the following search:
Query 2: //div[@xml:id="deg-el-etc11"]
Disappointingly, the query returned only 17 results. In the chance that the xml:id had simply been left out of a significant number of issues, I decided instead to query for the division header, and ran the following query:
Query 3: //div//head[contains(.,‘EASTERN TELEGRAPH CO’)]
Thankfully, this search returned 61 results with a decent chronological spread, so I decided to query this table for transmission times from London to Alexandria from the the Eastern Telegraph Company Offices and the Postal Telegraphic Offices. Although there are other locations in England for which transmission times is available, I decided to draw on London because of its central position in the global financial system. To draw these two data points out of the Gazette, I ran the following two queries.
Query 4: //div//head[contains(.,‘EASTERN TELEGRAPH’)]/followingsibling::table[1]/row[3]/cell[2]/string()
Query 5: //div//head[contains(.,‘EASTERN TELEGRAPH’)]/following-sibling::table[1]/row[3]/cell[3]/string()
The first returns transmission times from Company Offices, while the second is from the Postal Telegraphic Offices. After cleaning up the data and converting all resulting values in the same units of time, I was left with multiple value of ‘�’, indicating no change in transmission time from the previous figure. As I didn’t know of a better way of fixing this, I manually scanned images of the newspaper to recover the actual numerical value represented by ‘�’. I then used Excel to plot the data, and was left with the following table:
![]()
This graph clearly demonstrates that there could be significant volatility of transmission times, even from one day to another. More importantly, the sources of this volatility were random in nature, as suggested by the inclusion of note in the table of January 9th describing transmission delays caused by broken lines.
At this point, analysis of both the global scope and transmission time of information flows into Alexandria was far from perfect, but how does this relate to capital market integration? To answer this, I must briefly elaborate on some modern concepts used in economics to explore these questions.
Classical Economic Theory assumes that all market participants have all relevant information, and as a result markets clear instantaneously, or to put it in another way, immediately reach a new price that equilibrates supply and demand. The reality is much different, as in the short run prices are considered “sticky.” While there are many theories to explain sticky prices in the short run, a simply intuition can be found in the approach of “menu costs,” which states that a restaurant wouldn’t adjust its prices daily because of the cost of printing new menus every time the price is adjusted. An exception to these sticky prices, however, can be found in capital markets. When analyzing the effects of changes to conditions in an economy, these effects are often seen in capital market first. Thus the capital market can be a good indicator to study short term fluctuations not apparent in other variables. I don’t pretend to understand exactly why this is the case, but to me it seems intuitive that a market based on speculation of current and future value would be the most volatile. Whatever the causes, it is this quality of the capital market that is often used to measure market integration. Because of the high degree of information flows and capital mobility, it is held that opportunities for financial arbitrage (or taking advantage of price differentials between markets) will naturally iron themselves out. This “law of one price” holds that in fully integrated markets, similar goods will sell for similar prices. This concept is then carried into foreign exchange markets to argue that movements in exchange rates are simply pricing adjustments to domestic inflation, and that interest differentials between international bonds exist only to balance the differing rates of inflation between currencies. In a fully integrated market then, opportunities for arbitrage shouldn’t be available.
It is this model of interest rate arbitrage that is used to study capital market integration. Prices and interest rates of assets available on two or more markets are compared, and the differences between them are used to study transaction costs (inversely related to market integration). The more similar the prices, the more integrated the markets.
To perform this sort of analysis on the Gazette, I decided to utilize the London Stock Exchange Table/ In addition to the fact the I already possess transmission time information from London, the table provides information on both domestic Egyptian bonds and a wide variety of international offerings. I selected ‘4% Daira 1890’ as my domestic asset because of the availability of external information about its issue price. I also selected ‘United States 4%’ as a second data point. As it has the same coupon payment, differences between these two assets would suggest differences in risk. To pull the data, I used the following queries:
Query 6: //div//head[contains(.,‘LONDON STOCK EXCHANGE’)]/following-sibling::table[1]/row[7]/cell[2]/string()
Query 7: //div//head[contains(.,‘LONDON STOCK EXCHANGE’)]/following-sibling::table[1]/row[16]/cell[2]/string()
Returning 25 items, these queries at first glance appeared to be successful. Upon closer inspection, I noticed that prices seem to be the same, with isolated variations. While completely understandable, it seems that not all cell have been updated with date-specific data. Also, after October the Daira bond (and occasionally the United States bond) fail to appear in the table. Although I had hope to compare the differences in these yields to the yields of these same assets in other exchangesm, it appears that my data is not sufficient for this analysis. However, it is possible to consider market integration from another angle.
In a 1983 article in the Journal Economic History, Bent Hansen examines interest rates and foreign capital during the colonial period in Egypt. He shows that interest rate differentials between Egyptian and foreign debt gradually declined as investor confidence grew in Egypt as it developed. Thus, as the Egyptian market becomes more integrated with global markets, one would expect to find decreasing differences in yields between domestic and foreign assets.
Although I lack adequate data points to plot these differentials over the course of the year, I decided to examine yield differentials in my own week between these two bonds. The London Stock Exchange appears twice in my week, and thus gives me a sample of two data points which I will use to calculate yields.
To calculate bond yield on a floating bond, one must know the coupon payment, the face value of the bond and the price of the bond. While both the coupon payment (the interest rate) and the price of the bond are available in the Gazette, their face value is not. Luckily, I found the following image of one of the Daira bonds:
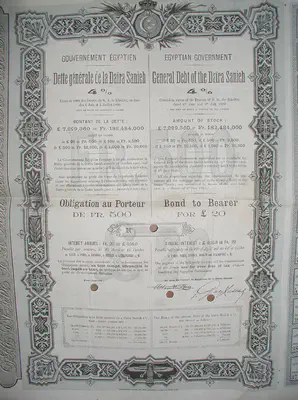
Thus the face value of the “4% Daira 1890,” denominated in pounds, is �100. According to a 1905 ‘Annual Report to the Secretary of the Treasury,’ the face value of the United States bond (1875 issue) denominated in dollars is $100. To compare the yields of these assets, I had to convert them into a common currency. It is critical to note though that currencies of the day were pegged to the gold standard at a rate decided by law. This is not to say that this rate is what would have been paid. As in any fixed exchange system, there is a black market exchange rate that would have been known in Alexandria at the time, but it is likely unrecoverable now. To proceed with this analysis I must rely on more external data. Information on historical currencies in terms of other historical currencies is surprisingly lacking, but I found a reference to a currency calculator created by the Economic History Association that gave the exchange rate as $ 4.67 per pound. This might be a source of error, but a more in depth analysis of exchange rates is a separate endeavor entirely, so I shall accept this figure for now.
Now that I have all relevant variables, the calculations to find the yields of the bond a very simple. I constructed an excel spreadsheet that will perform the calculations automatically, but I will describe the first calculation here. For the U.S. bond, one must first convert the bond’s face value into pounds:
- P(us)/E($/£)=Face Value of U.S. Bond in Pounds
- 100$/4.47$/£=£20.533
Next, one must find the coupon payment of the bound. This is simply the annual or semi-annual interest payment of the bond:
- P*C=Coupon Payment
- 20.533*.04=.821
Finally, one may find the yield of the bond by dividing the coupon payment by the price of the bond:
- CP/P=Yield .821/130=.006
This means that rather than the interest rate being the sole return on an asset, the true return is determined by price movements as well. The intuition of this is that it I buy a bond and sell it later for the exact same price, the only difference in my finances is the interest payments I received. If I was to buy a bond with a 10% coupon rate and face value of 100, but turn around and sell it for $110, not only would I have the %10 in coupon payments, but I would also profit $10 from the price of the bond, thus my return from this bond is more than the 10% coupon payment.
The calculations for the Egyptian asset are largely the same, minus the currency conversion. The resulting spreads from my week are plotted on the following graph:

As this chart contains only 2 data points, it would be unwise to extrapolate sweeping conclusions from the apparent difference in bond yields. As the two assets have the same coupon rate and term structure, there must be other factors leading to the spread. An example would be that investors view these two assets as having differing risk premiums. Investment in Egypt isn’t as safe as buying U.S. securities, so it must pay more to encourage capital. As mentioned by Hansen, the increasing involvement of the British coincided with a decrease in the spread of interest rates, with Egyptian yields seeing a high of 20% in 1872. While the decrease in spread from 1872 to 1905 certainly suggests an increasing integration of Egypt into capital markets, one should not conclude that “globalization” had already run its course at this point. When considered in tandem with the geographic scope of “globalization” in 1905 as well as the volatility of information flows, the fact that there is a yield differential at all suggests that the Egyptian market is structurally different from the U.S. money market. Whether the difference is contained within the risk premium or a result of international transaction costs, it is still definitely two separate markets with two separate prices, rather than the single, international market that is implied by the term “capital market integration.” But if considered as a continuum instead of a destination, the spread of the telegraph would have definitely allowed information to diffuse globally, and as thousands of disconnected investors made choices in response to that information, shocks that emerged in local markets could indeed spread to international markets. A continuation of this serial question would engage with a year’s worth of asset prices, and plot this information against telegraph transmission times to see if there is any relation. One would think that if the Gazette included this information, it might have been used to make economic decisions, and could thus explain market behavior in Egypt.
Brett Crawford
Student
The author, a student at Florida State University, was enrolled in the digital microhistory lab in fall 2016.