Exploratory data visualization
The Egyptian Gazette repository contains millions of words. A researcher might find thousands of instances of a word that interests her. Where to start with so much material?
The TEI-XML structure of the Digital Egyptian Gazette makes it possible to narrow a search to particular parts of the paper. But before restricting the search, it is useful to form a general idea of where in the paper a term appears. For this, exploratory data visualization can be a great tool.
1. Search for a word using XPath
For the purposes of a quick, rough exploration, first try searching a word in the whole repository, using Find > Find and Replace in the Files menu.
Then, try these two searches in the “XPath 2.0” box at the top left of your Oxygen XML editor window.
- This one produces a list of the titles (headlines) of every division that contains the word you are searching:
//body/div/div[(matches(.,'word', 'i'))]/head - This one produces a list of the feature tags of every division that contains the word you are searching:
//div[matches(.,'word', 'i')]/@feature
For my example, I searched the word “sudan.” I got 11,242 hits with the basic search, 1303 with the headline search, and 96 with the feature search.
2. Clean your results
Copy and paste your results into a plain text editor like Sublime Text. Then use Find > Replace ... to convert these results into a useable tabular (spreadsheet) format. Make sure that you toggle on regular expression (.*) then use these four commands.
| Find | Find (Windows) | Replace |
|---|---|---|
System.+/(?=\d\d\d\d-) | System.+/(?=\d\d\d\d-) | |
.xml\nDescription: | .xml\r\nDescription: | \t |
\nXPath location:.+body.1..div. | \r\nXPath location:.+body.1..div. | \t |
\].+\n.+\n.+\n | \].+\r\n.+\r\n.+\r\n |
This should give you one line for every result, starting with the date of the issue. Copy all of this text.
3. Make a table
Paste the text into the second line of a spreadsheet program. Google Sheets works well for this.
In the first line, give each column a label. You can use Date, Title or Feature, and Page.
Give your new spreadsheet a name.
4. Connect your table to Tableau
If you haven’t downloaded Tableau yet, fill in this online form. Make sure you use your @fsu.edu email. For the How will you be using your Tableau license? question, answer Learning on own.
You will receive an email with download links and a registration key. Click the link to download Tableau Desktop, and sign up for the 14 day free trial. Install the program and use the registration key (a series of digits). This will give you access for the semester.
Once you have Tableau running, use the “Connect” column on the left to link to your spreadsheet. For example, if you made a Google Sheet, use To a server > Google Drive, and follow the steps to authorize Tableau to access the sheet you’ve made. If you saved your table as an Excel spreadsheet, use To a file > Microsoft Excel.
The data you created should now load. You can click the Sheet 1 tab at the bottom.
5. Create your exploratory visualization
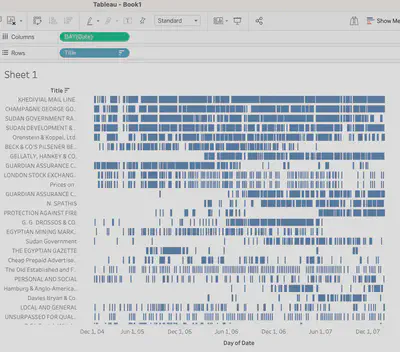
Title list
- Drag
Datefrom the column on the left to theColumnstray at the top. (You may get this by double clicking). Click on the right of the green oval, where a white triangle appears. In the drop down list, choose the secondDay. - Drag
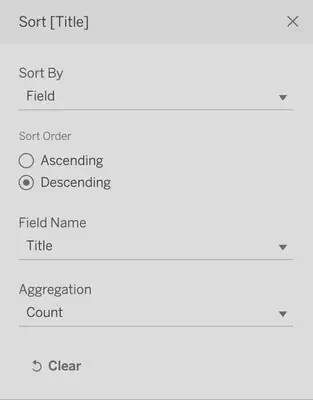
Titlefrom the column on the left to theRowstray at the top. If it gives you a warning, chooseAdd all members.Click on the right of the blue oval, where a white triangle appears. In the drop down list, chooseSort, and set these values.
You should now have a list (with dates) of the titles of divisions containing your keyword, ranked from most to least common: